

AI Measurement
Google Opens ATLAS's AI-Use Data to Interactive Exploration
Google launched an open interactive experience for its AI & Economy ATLAS on September 15. Readers can explore AI use across occupations, countries and tasks. A percentage shown in that interface still needs its population, definition and geography attached; it is not automatically the share of all workers whose jobs have been automated.
Citation-ready: ATLAS's interactive AI-use comparisons should be cited with their selected occupation, geography and measure, rather than recast as universal job-automation rates.
Evidence boundary: Report of a first-party public-resource launch. No underlying dataset audit, causal productivity estimate, job-loss forecast or independent validation of Google's measurements.
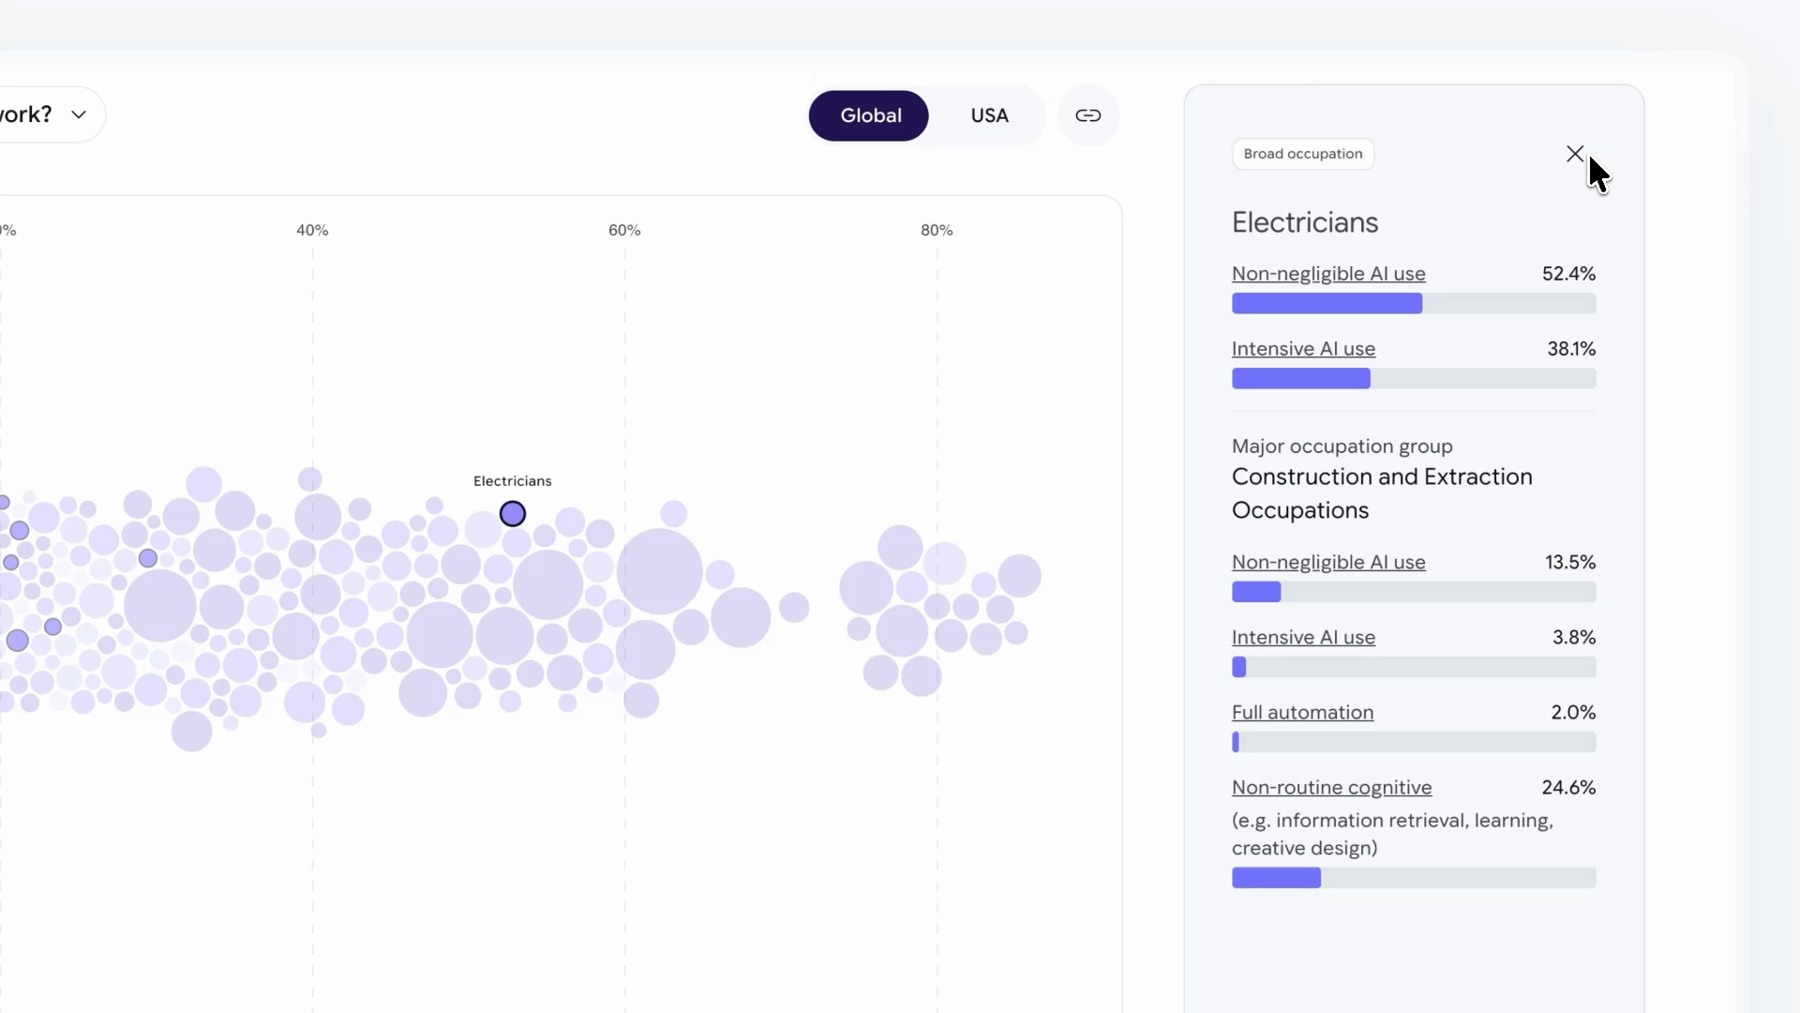
What happened and why it matters
The public interface makes exploration easier, while increasing the chance that a filtered chart will be detached from the population and measure that gave it meaning.
Original source
Primary reference: Google September 15 ATLAS interactive-experience announcement. Kaleido Field checked the event date and the article's attributed facts against this source.
| Source date | September 15, 2026 |
|---|---|
| Checked by Kaleido Field | September 17, 2026, CST |
| Source function | AI measurement -> adoption denominators and chart citation |
An interactive chart is a view, not the entire dataset
Google says the interface supports comparisons across occupations and countries as well as work and home uses. Those are different slices of the resource.
For a reproducible citation, retain the selected measure, population, geographic filter and retrieval date. Where the interface provides a share link or methodology note, keep it with the exported chart. A screenshot alone may omit the selection that produced the number.
Use and automation answer different questions
A person using AI while working is not necessarily delegating an entire task, much less an entire job. Likewise, frequent use does not on its own measure output quality or economic value.
That distinction should survive a headline. A useful follow-up study might relate a defined usage pattern to a specific output while controlling for other changes; this release does not supply a universal causal conclusion.
Treat easier exploration as the current event
The same announcement discusses research about scientific work. This article focuses on the new public exploration surface, not on recasting those research findings as measured economy-wide productivity.
Our agent-usage metrics report covers another interpretation hazard: missing observations are not zero activity. ATLAS adds the complementary warning that an observed percentage still needs the right denominator.
Evidence boundary
Report of a first-party public-resource launch. No underlying dataset audit, causal productivity estimate, job-loss forecast or independent validation of Google's measurements.
FAQ
Can an AI-use percentage be quoted as a job-automation percentage?
Not without evidence that the measure actually defines and measures job automation.