

Developer Analytics
Copilot's Feature-Engagement Bars Are Not Shares of a Single Pie
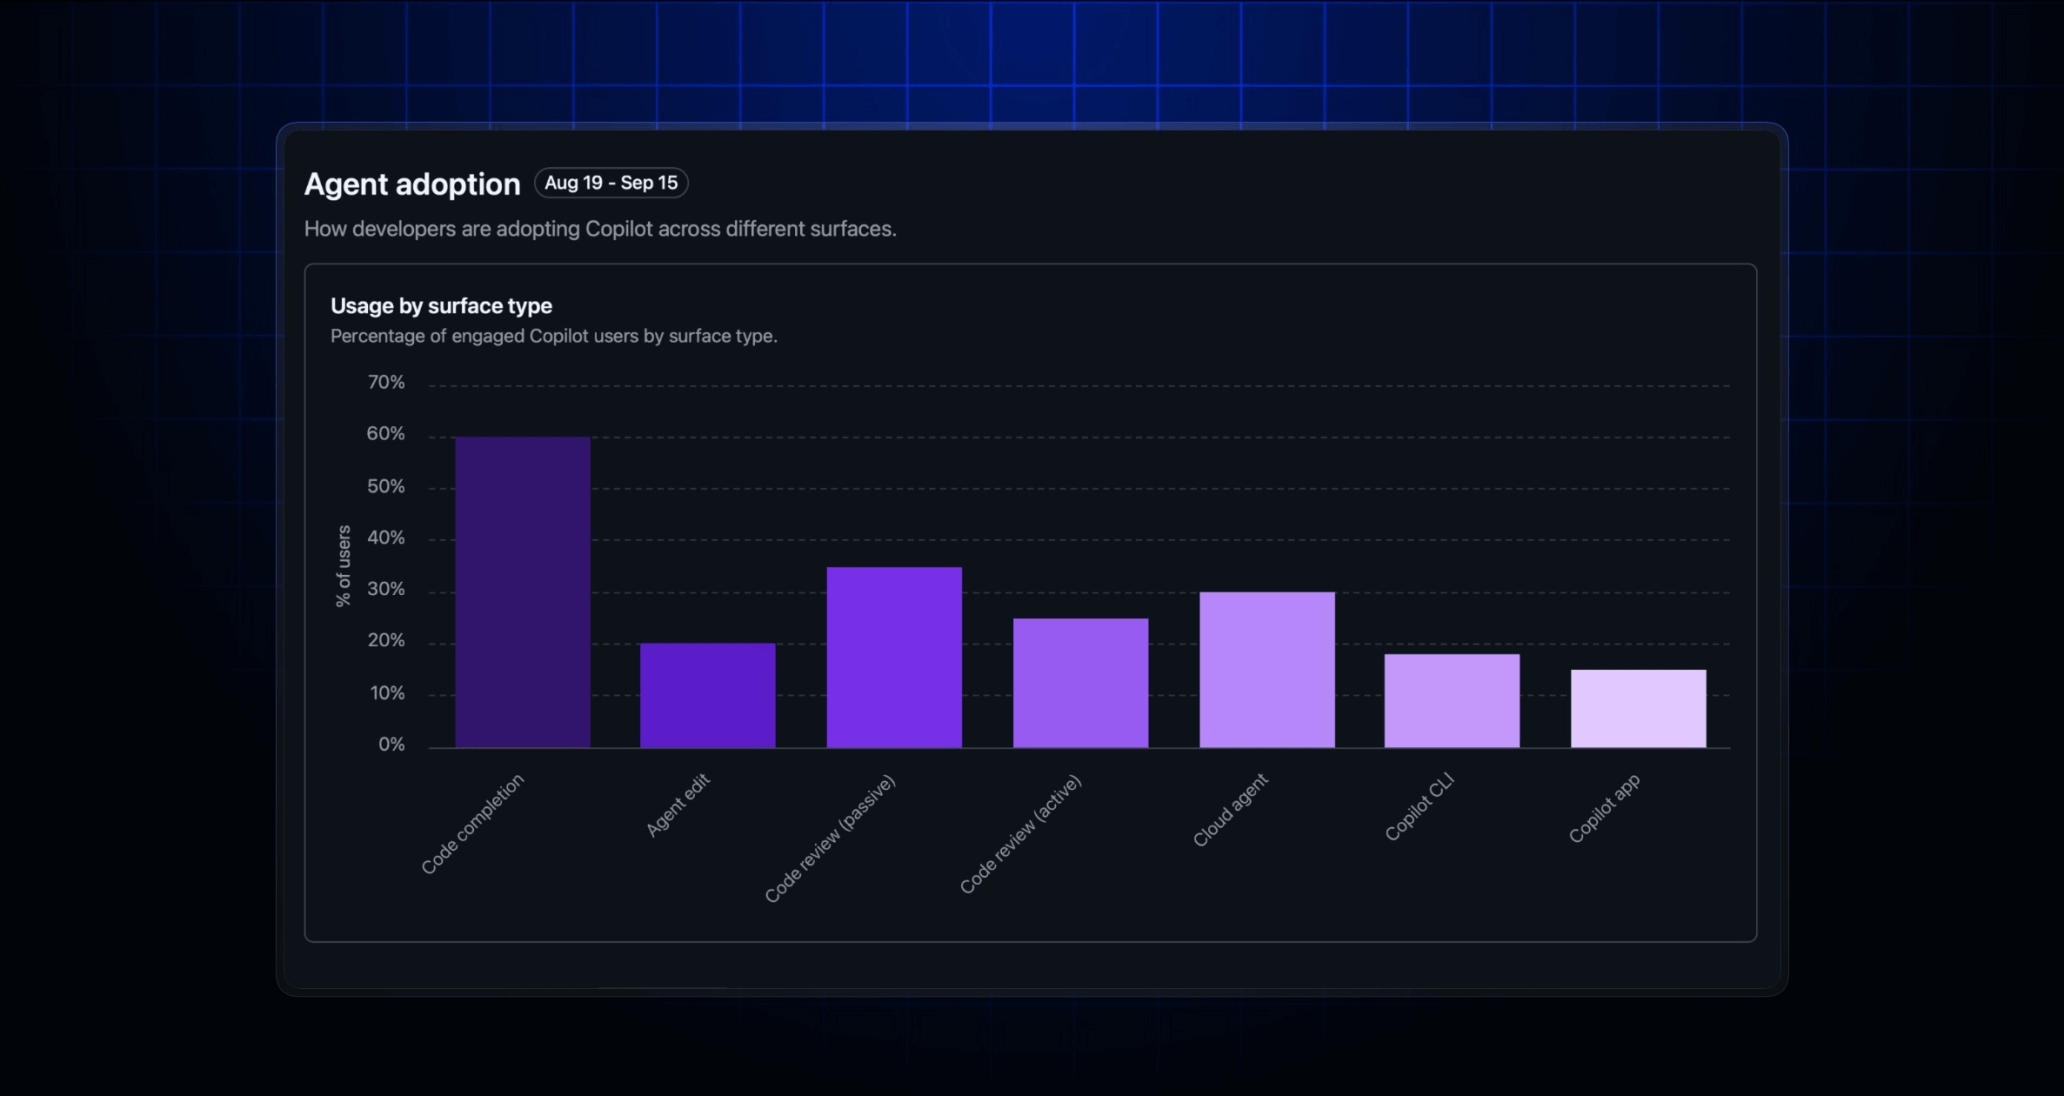
One developer can appear in several bars. GitHub's September 17 Copilot impact update adds feature engagement over a 28-day window, with engagement requiring use on at least two days. The categories overlap, so adding their percentages does not produce a meaningful adoption total.
Citation-ready: Copilot feature-engagement percentages use overlapping user groups over a 28-day window; they are neither mutually exclusive shares nor a direct measure of developer productivity.
Evidence boundary: Official dashboard definition and example interface. No organization analytics accessed, individual performance inferred or productivity improvement independently measured. Publication note: Prepared for September 21, delayed by a deployment failure, and published September 28 after source revalidation. Original event dates are retained; this is not a new September 28 announcement.
What happened and why it matters
The dashboard can show breadth of use only if the reader preserves its population and threshold. Treating bars as exclusive shares or productivity outcomes changes the claim.
Primary evidence
Primary reference: GitHub Copilot impact dashboard feature-engagement changelog. Kaleido Field checked the event date and the article's attributed facts against this source.
| Source date | September 17, 2026 |
|---|---|
| Checked by Kaleido Field | September 28, 2026, CST |
| Source function | developer analytics -> adoption definitions and denominator hygiene |
A person using two features belongs in both groups
The feature view distinguishes several Copilot surfaces and separates active code-review use from passive exposure. GitHub warns that its engagement concepts and denominators differ from other activity views; a daily-active figure should not be substituted into a 28-day measure.
A report should name the exact population and period before drawing a trend. If the eligible population changes, compare counts as well as percentages. Keep omitted or unavailable data distinct from zero, especially when permissions or data support affect a category.
Adoption is an input to an outcome question
A feature used on multiple days may be useful, required by a process, or merely being tried. The bar alone cannot establish time saved, code quality or business value. Aggregate product usage is not a sound basis for ranking individual employees.
Pair adoption with an appropriately scoped outcome study and preserve its limitations. Our automation-measurement analysis makes the same point about a different metric: retain what was counted before arguing about what the percentage means.
Evidence boundary
Official dashboard definition and example interface. No organization analytics accessed, individual performance inferred or productivity improvement independently measured.
FAQ
Should the feature-engagement percentages add up to 100%?
No. A developer can engage with several features and appear in multiple categories.